Classical tests · Other
One-Way Analysis of Variance
One-way ANOVA compares variation among group means with variation inside groups.
Partitioning total variation
For $J$ groups, total squared variation separates into between-group and within-group components.
The classical test statistic is
A three-group example
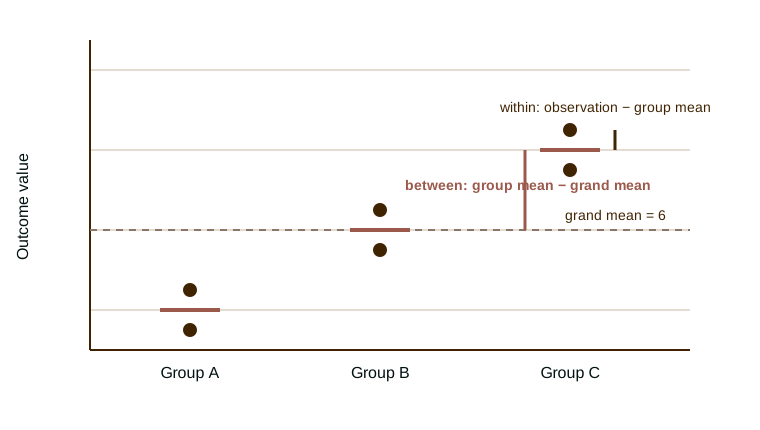
Suppose the group means are 4, 6, and 8, with two observations per group and grand mean 6.
| Group | Mean | $n_j(\bar y_j-\bar y)^2$ |
|---|---|---|
| A | 4 | 8 |
| B | 6 | 0 |
| C | 8 | 8 |
Then $SS_B=16$. If $SS_W=6$, the statistic is $(16/2)/(6/3)=4$.
Assumptions and implementation
Exact classical ANOVA inference assumes independent observations, common group variance, and normally distributed errors within groups. The F statistic is identical to the joint test of group indicators in an OLS regression.
Numeric group codes must be treated as categories. A regression on the numeric codes imposes a linear trend and answers a different question.
The decomposition figure separates each observation's deviation into a group-mean component and a within-group component.
Interpreting the decomposition
The $F$ statistic asks whether the fitted group means explain more variation than random within-group scatter would predict. A large value supports a difference somewhere among the means. It does not identify the differing pairs. Report every group mean and sample size beside the global statistic. Add planned contrasts or adjusted pairwise comparisons when the scientific question names specific groups. An effect-size measure, such as $\eta^2=SS_B/SS_T$, describes the share of observed variation assigned to group membership. Its meaning remains descriptive unless assignment or sampling supports a causal or population interpretation.
In the example, the means form a symmetric pattern around 6. Group B contributes nothing to $SS_B$, while groups A and C each contribute 8. The global calculation combines both departures.
Implementation checks and failure modes
Store group labels as categories and inspect each cell before fitting the model. Empty cells, miscoded labels, and a single extreme response can change both sums of squares. Recompute $SS_B$ and $SS_W$ from the group summaries as a direct check. The regression version should give the same fitted values, residual sum of squares, and $F$ test.
Classical ANOVA uses one residual variance for all groups (Fisher, 1925). When spreads differ and group sizes are unbalanced, Welch's ANOVA provides a separate approximation (Welch, 1947). Repeated measurements or clustered observations require a model for that dependence. Examine residual plots and the displayed decomposition before interpreting the test. If the global test motivates follow-up comparisons, state their multiplicity adjustment and confidence intervals.
Further reading
Fisher develops variance decomposition and the F framework (Fisher, 1925). Modern regression texts show the equivalence with indicator-variable OLS (Wooldridge, 2010).
Sources and further reading
- Ronald A. Fisher. 1925. Statistical Methods for Research Workers. Oliver and Boyd. Source.
- Bernard L. Welch. 1947. “The Generalization of Student's Problem When Several Different Population Variances Are Involved.” Biometrika 34(1/2): 28--35. doi:10.2307/2332510.
- Jeffrey M. Wooldridge. 2010. Econometric Analysis of Cross Section and Panel Data. MIT Press. Source.
About this benchmark task
- Status
- In the benchmark
- Identifier
anova_oneway- Family
- Other
- Software
- Stata, R, Python
- Source
- Benchmark task set
Task statement
Run a one-way ANOVA of y by group. Report the omnibus F statistic, numerator degrees of freedom, denominator degrees of freedom, and p-value as rows F, df_num, df_den, and p_value.
Required output
F, df_num, df_den, p_value