Regression diagnostics · Other
Cook's Distance and Influential Observations
Cook's distance measures how much an OLS fit changes when one observation is removed.
Influence combines two ingredients
An observation is influential when it has a large residual, high leverage, or both. Cook's distance summarizes its case-deletion effect (Cook, 1977).
Here $h_{ii}$ is leverage and $p$ is the number of fitted coefficients.
Same residual, different leverage
Let $p=2$, $MSE=1$, and $\hat u_i=2$.
| Leverage $h_{ii}$ | Cook's distance |
|---|---|
| 0.05 | 0.111 |
| 0.20 | 0.625 |
| 0.50 | 4.000 |
The denominator $(1-h_{ii})^2$ makes high-leverage cases especially sensitive.
Assumptions and interpretation
Cook's distance is a diagnostic for a declared fitted model. It is not meaningful before the outcome and regressors are specified. A large value signals sensitivity and calls for inspection. It does not automatically justify deletion.
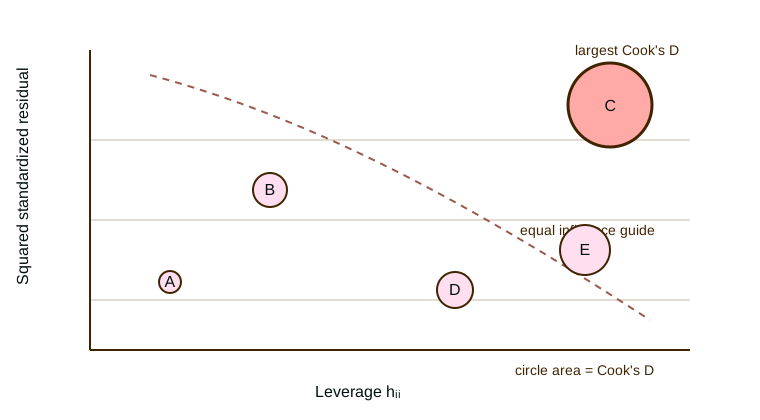
Software can report distances using slightly different scale labels. Row identifiers must remain attached after sorting. A two-axis influence map should place leverage horizontally, squared residual vertically, and encode Cook's distance with contour lines.
Reading an influence measure
Cook's distance measures the combined change in fitted values after deleting case $i$. A large value marks sensitivity. It does not prove that the observation is wrong. High influence can arise from an unusual predictor value, a large residual, or both. The figure shows why equal residual magnitudes can yield different distances when leverage differs.
List influential cases with their response, predictors, leverage, studentized residual, and Cook's distance. Then refit the model without each flagged case and compare the coefficients that answer the research question. DFBETAs can show which coefficient moves. A data correction needs evidence from the source record, not a diagnostic threshold.
Diagnostic workflow and limitations
Compute influence measures from the exact fitted design matrix, including transformations, interactions, and fixed indicators. Check that row identifiers remain stable after missing values are removed. Common guides such as $4/n$ are screening conventions. They are not universal decision rules. Simulated envelopes or substantive knowledge can give more useful context.
Several influential observations can mask one another. Inspect joint deletions when cases share an extreme predictor pattern. A large Cook's distance can also reveal curvature, omitted interactions, or variance misspecification. Plot residuals against fitted values and each continuous predictor before treating the issue as a single case. Robust standard errors change reported uncertainty but do not reduce leverage or repair the conditional mean. If the model will predict new units near the influential case, deleting that region may weaken external validity. (Cook, 1977)
Further reading
Cook introduces the distance measure (Cook, 1977). Belsley, Kuh, and Welsch develop a broader framework for regression diagnostics (Belsley et al., 1980).
Sources and further reading
- R. Dennis Cook. 1977. “Detection of Influential Observation in Linear Regression.” Technometrics 19(1): 15--18. doi:10.1080/00401706.1977.10489493.
- David A. Belsley, Edwin Kuh, Roy E. Welsch. 1980. Regression Diagnostics: Identifying Influential Data and Sources of Collinearity. Wiley. doi:10.1002/0471725153.
About this benchmark task
- Status
- In the benchmark
- Identifier
cooks_distance- Family
- Other
- Software
- Stata, R, Python
- Source
- Benchmark task set
Task statement
Fit y on x1, x2, x3, x4, and x5 with an intercept. Compute Cook's distance for each row and report the top five row indices and values as rank1_obs_id, rank1_cooks_d, ..., rank5_obs_id, rank5_cooks_d. Use zero-based row indices.
Required output
rank1_obs_id, rank1_cooks_d, rank2_obs_id, rank2_cooks_d, rank3_obs_id, rank3_cooks_d, rank4_obs_id, rank4_cooks_d, rank5_obs_id, rank5_cooks_d